Archives

Showing posts with label Reporting Services. Show all posts

Tuesday, November 23, 2010

Drupal 7 and SQL Server Reporting Services

Drupal is a popular content management system that until relatively recently has been associated more or less exclusively with the LAMP (Linux, Apache, MySQL, and PHP) Web development stack. However, Acquia Drupal is now available for Windows and can be installed with the Microsoft Web Platform Installer, and at DrupalCon in San Francisco, it was announced that a new SQL Server PHP driver for PDO and a SQL Server module for Drupal 7 would be released, enabling Drupal site data to be hosted in SQL Server. You can download a pre-release version of a Drupal and SQL Server package from here.
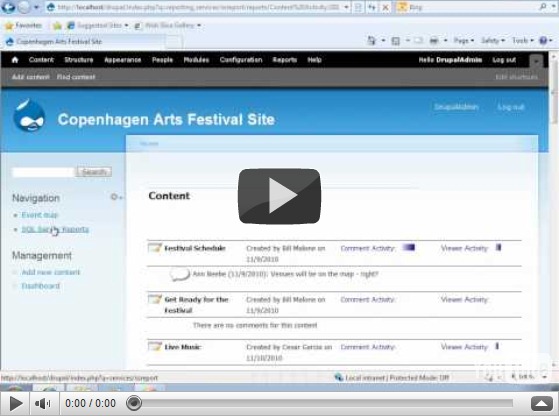
Drupal and Reporting Services Demo

Drupal is highly extensible through its PHP-based modular architecture, and SQL Server includes a wealth of features that could potentially enhance the value of a community-based content site, so given that you can now install Drupal with SQL Server, it seemed logical to do some investigation into how you can integrate some of the capabilities of SQL Server into a Drupal site.

Perhaps the most obvious starting point is to integrate Reporting Services into a Drupal site to create a sort of “Community Dashboard” that includes reports showing content and author related activity within the site. SQL Server Express Edition with Advanced Services includes Reporting Services for free, and the SQL Server Reporting Services SDK for PHP provides a framework for accessing Reporting Services from PHP-based applications. The video shows the Drupal solution we created using these technologies (you can also view this video on YouTube).

The demo actually shows “bi-directional” integration between Drupal and SQL Server Reporting Services in the sense that not only does the site include a custom PHP module to “pull” the reports from Reporting Services into the Drupal site user interface, the reports themselves query data in the underlying Drupal content database, which in this instance is hosted in SQL Server 2008 R2 Express Edition.

The diagram below shows the high-level architecture of the integration solution we created. Note that the Reporting Services instance contains two folders – one containing reports that show activity for all users, and another containing reports that are filtered based on the current Drupal user’s ID. The custom module in the Drupal site ascertains whether the current user is an administrator, and if not retrieves the current user’s ID via the Drupal PHP API and passes it as a hidden parameter when retrieving the reports.

Reporting Application Architecture

The reports query the tables in the Drupal content database. For example, the following query is used to retrieve the data for the Content Activity report:

SELECT n.Title Page,
       cast(dateadd(ss,n.created,'1/1/1970') as Date) CreatedDate,
       u.name Author,
       c.[Subject] Comment,
       uc.name [Commenter],
       cast(dateadd(ss,c.created,'1/1/1970') as Date) CommentDate,
       cn.totalcount PageViews
FROM dbo.Node n
JOIN dbo.Users u ON n.[uid] = u.[uid]
LEFT JOIN dbo.Comment c ON n.nid = c.nid
LEFT JOIN dbo.Users uc ON c.[uid] = uc.[uid]
LEFT JOIN node_counter cn ON n.nid = cn.nid
WHERE MONTH(cast(dateadd(ss,n.created,'1/1/1970') as Date)) = @Month
AND YEAR(cast(dateadd(ss,n.created,'1/1/1970') as Date)) = CONVERT(char(4),@Year)

Note that the date values in the Drupal database are stored in the standard UNIX format (the number of seconds since 1/1/1970), and so need to be cast to an appropriate SQL Server data type (we’ve used the Date datatype).

Our custom module code uses the SQL Server Reporting Services SDK for PHP to connect to and retrieve information from Reporting Services. For example, the following code is used to retrieve a list of available reports in the appropriate folder in Reporting Services (depending on whether or not the user is an administrator):

/*
  connect to SQL Server Reporting Services and retrieve a list of available reports
  */
function getReports(){
module_load_include('php', 'ssreport', 'bin/SSRSReport');
    
    $reports = array();
try
{
    $ssrs_report =  new SSRSReport(new Credentials(variable_get('ssreport_user'), variable_get('ssreport_password')), variable_get('ssreport_url'));
    $childPath = "";
 
// if user is admin then load from community dashboard
if (user_access('Administer site configuration')){
   $childPath = variable_get('ssreport_primary');
}
else{
// load from personal dashboard
   $childPath =  variable_get('ssreport_secondary');
}

$catalogItems = $ssrs_report->ListChildren($childPath, true);

foreach ($catalogItems as $catalogItem) {

if ($catalogItem->Type == ItemTypeEnum::$Report) {
$reports[$catalogItem->Name] = $catalogItem->Name;


}
}

}catch(SSRSReportException $serviceException)
{
    drupal_set_message($serviceException);
}
return $reports;

}

Note that the code uses a number of variable_get calls to retrieve global variables that are set in the Drupal administrative (such as the credentials to access the Reporting Services instance, the URL of the Reporting Services Web service, and the path to the CommunityDashboard and PersonalDashboard folders). Finally, the code uses the SSRSReport.ListChildren method provided by the SQL Server Reporting Services SDK for PHP API to retrieve the list of reports.

When a user selects a report, the following PHP function is used to retrieve the list of parameters that the report expects:

$rep=NULL;
if (user_access('Administer site configuration')){

$rep = t(variable_get('ssreport_primary').'/@report',array('@report' => $report));
 
}
else{
$rep = t(variable_get('ssreport_secondary').'/@report',array('@report' => $report));

}

// connect to SQL Server Reporting Services using the credentials and URL supplied in the administrative dashboard
$rs = new SSRSReport(new Credentials(variable_get('ssreport_user'), variable_get('ssreport_password')),variable_get('ssreport_url'));
$params = array();
  try
{
// get the parameters for the specified report
$reportParameters = $rs ->GetReportParameters($rep, null, true, null,     null);
    
$params = array();
        
foreach($reportParameters as $reportParameter)
            
{
    array_push($params,$reportParameter->Name);            
   
}

Finally, the following code is used to render the selected report in the Drupal user interface:

$rs = new SSRSReport(new Credentials(variable_get('ssreport_user'), variable_get('ssreport_password')),variable_get('ssreport_url'));
//get the report params array
  $path = drupal_get_path('module','report_services');

$reportParameters = $rs ->GetReportParameters($rep, null, true, null,     null);
    
$params = array();
        
foreach($reportParameters as $reportParameter)
{
  //code to set the parameter values

}

       $rs->SetExecutionParameters2($parameters);
   

    // delete existing image files
    $dirname = './images/';
   $dir_handle = opendir($dirname);
   if (!$dir_handle)
      return false;
   while($file = readdir($dir_handle)) {
      if ($file != "." && $file != "..") {
         if (!is_dir($dirname."/".$file))
            unlink($dirname."/".$file);
         else
            delete_directory($dirname.'/'.$file);    
      }
   }
   closedir($dir_handle);

    $htmlFormat = new RenderAsHTML();

  $htmlFormat->StreamRoot = './images/';
 
  $result_html = $rs->Render2($htmlFormat,PageCountModeEnum::$Estimate,$Extension,$MimeType,$Encoding,$Warnings,$StreamIds);

      $i = 0;

      // handle the images by writing them to the temp images folder
      foreach ($StreamIds as $StreamId){

$result_image = $rs->RenderStream($htmlFormat,$StreamIds[$i],$Encoding,$MimeType);

if (!$handle = fopen("./images/" . $StreamIds[$i] , 'wb'))
{
  echo "Cannot open file for writing output";
exit;
}
if (fwrite($handle, $result_image) === FALSE)
{
echo "Cannot write to file";
exit;
}
fclose($handle);
$i++;
}
// construct the html of the report
$content="<div align='center'>";

$content .="<style type='text/css'> td{border-top-width: 1px;border-top-style: solid;border-top-color: transparent;}</style>";
$content .="<div>";

$content .='<div>';
/* add the report content */
$content .=$result_html;
$content .='</div>';

$content .='</div>';

Note that the report is rendered as HTML by the Render2 method of the SSRSReport class provided by the SQL Server Reporting Services SDK for PHP . If the report contains any images or charts, the method generates image files for these and stores them in a specified folder – hence the requirements to clear out the image folder before rendering the report to remove any images left over from previously viewed reports. One gotcha that we found when implementing the solution was that these images are generated with no file extension, so we had to configure IIS to map the .* file name pattern to the Image/png MIME type.

The solution we built was based on pre-beta releases of Drupal 7 and the related SQL Server driver for PDO and SQL Server module. Given the complex dependencies on multiple pre-release software components, it seems foolhardy to publish the full source code for this solution until all of the dependencies are stabilized in a final release.  At that point, the plan is to update the code for our solution and publish it on CodePlex so that anyone can examine and extend it, so watch this space!

Read More >>

Wednesday, October 13, 2010

Using a Transparent Background in Reporting Services

While watching the Japanese Formula 1 Grand Prix on Sunday, it struck me that TV sports broadcasters make a lot of use of transparent overlays when showing scores, results, times, statistics, or whatever. In the case of the Grand Prix, the driver rankings in the world championship were displayed on a semi-transparent overlay, behind which the live footage of the race circuit could be seen.

So, naturally I started to wonder how I could achieve a similar visual effect in a Reporting Services report, like this:

Product Sales Report

My first thought was to look at the BackgroundColor property of the Tablix data region and set the Transparency level. However, when I looked at the color picker control for the property, this is what I saw:

ColorProperties

Note that the Transparency control is disabled. It turns out you can only set a transparency level for gauges and charts in Reporting Services – not for shapes or data regions. So, I needed to find an alternative approach.

The answer I came up with was to create a semi-transparent .png graphic, and use it as the background image for the data region. I created this with PowerPoint, though of course you can use any graphics tool you like. I also used PowerPoint to find a suitable clipart image to use as the background for the report (on which the semi-transparent data region will be overlaid). In this case, I’m using the Adventure Works Cycles sample data, so a photo of a cyclist seems like a good choice.

PowerPoint

You can take one of two approaches when it comes to sizing the semi-transparent image – you can make an extremely small image and then set the BackgroundRepeat property of the data region to Repeat, or you can make it bigger than the data region is ever likely to be and set the BackgroundRepeat property to Clip (or Repeat – it won’t matter since the image will be bigger than the data region anyway!). I found that PowerPoint tends to add some whitespace to the edge of a shape when you save it as a .png image, which showed up when repeating the background image, so I went with a large background image. Of course, had I used a more comprehensive graphics tool,  could have easily avoided this issue and got away with repeating a smaller image.

To embed the images to the report, I added them to the Images folder in the Report Data pane in Report Designer.

ReportData

Then I set the BackgroundImage property of the tablix data region in which the report data is displayed, like so:

TablixProperties

I’ve also used the semi-transparent image as the background for the report title textbox, which appears above the tablix data region.

The next challenge was to apply the cyclist image to the background of the report, and ensure that the layout of the report overlays the data neatly. If you have a small data set with a known number of records(for example, in a “top 10 products” report), then this is relatively straightforward. However, for a dataset with an unknown size, the data region will be resized dynamically, and automatic pagination may break the report into multiple pages. In my case, I want to ensure that the report title appears on all pages, and that the table of data has a suitable space above and below it on all pages.

To accomplish this, I added a page header and footer to the report and put the report title in the header. This ensures that if the report is paginated, the table on the second (and all subsequent pages) doesn’t start right at the top of the page. Similarly, the report footer ensures that there’s always a space after the table – it never goes all the way to the bottom of the page. I set the BackgroundImage of the report to the cyclist picture (clipped so it doesn’t repeat), and I set the InteractiveSize property of the report so that when viewed in the browser, the report has a maximum size that will keep the tablix well within the background image area. This was made tricky by the fact that Report Designer does not show the background image of the report in design view, so I had to preview the report and assess the right size through trial and error.

Report Designer

Obviously, the report size is optimized for interactive viewing, and though you can set the PageSize property of the report to an appropriate size for any other renderers you plan to use, my experience is that using background images and contrived layouts in reports you intend to render to a different format can result in some pretty horrible looking exported reports. One solution I have used in the past for this is to create the version that’s tailored for online viewing, and include a link to an offline version that has more conventional formatting for printing or exporting.

You can download the sample report I created from here. You’ll also need SQL Server 2008 R2 with Reporting Services (you can get the free Express edition from here) and the AdventureWorksDW2008R2 sample database (which you can get from here).

del.icio.us Tags: ,
Read More >>

Tuesday, June 8, 2010

Creating Multi-Sheet Workbooks with SQL Server 2008 R2 Reporting Services

One thing I’ve learned in over ten years of creating database and reporting solutions, is that no matter how dynamic and interactive you make online reports, no matter how to embed live reporting into the user interface of applications, and no matter how funky a dashboard you design; many executives don’t believe data is real unless it’s in a spreadsheet. That’s why one of the most used features of Reporting Services is the ability to render reports in Excel format.

However, I recently encountered a situation where Content Master hosts a Luminosity learning management system, and uses SQL Server Reporting Services to generate reports of student activity in Excel format. The number of students has grown substantially over time, and we hit an unforeseen problem – The Excel 2003 format that Reporting Services renders the reports in supports a maximum of 65,536 rows per worksheet, and the report (which shows students and all training they have completed) has grown to exceed this limit.

After some head scratching, I investigated enhanced new page-break support in SQL Server 2008 R2 and came up with a solution that works, and which can enhance the ability to create complex reports in Excel format for those pesky executives – so I thought I’d share it here.

Let’s imagine your executives want a report in Excel format that lists every customer, along with their contact details. If you have less than 65,537 customers, you could design a report that simply lists them in a worksheet, but if you have more customers than that (or you want to include headers, spaces, or other elements in your report that will use rows when rendered to Excel), then you’ll need a better solution. Ideally, you might want to create something like this – an Excel workbook with multiple worksheets, consisting of a generic “cover page” and a tab for each letter of the alphabet so that you can view customers by last name.

Workbook

You can download a copy of this workbook from here.

Each worksheet in the workbook lists customers with a last name that begins with the letter on the corresponding worksheet tab, as shown here:

Customers-A

To create this report, I used the AdventureWorks2008R2 sample database (which you can download from here) and the following Transact-SQL query:

SELECT Title, FirstName, LastName, AddressLine1, City, StateProvinceName, PostalCode, CountryRegionName
FROM Sales.vIndividualCustomer

The report includes a tablix data region that includes a details grouping (in which all fields are displayed) and a grouping based on the following expression (which returns the first character of the LastName field in upper-case):

=ucase(left(Fields!LastName.Value, 1))

I also added an image and a textbox to the report, and placed them above the tablix data region as shown here:

ReportDesign

To create the page breaks that generate the worksheets when rendered to Excel,  I’ve used some of the new page-break support in SQL Server 2008 R2. First of all, I’ve set the report’s InitialPageName property to Customer Addresses, as shown here:

ReportProperties

This property defines the default name for the first page of the report (or for all pages if no explicit page breaks with page names are defined). That’s why in the Excel workbook, the “cover page” has this name on its worksheet tab (if the InitialPageName property wasn’t set, the worksheet tab would show the the report name).

Next, I created a page break at the start of the tablix as shown here:

TablixProperties

This causes the data in the table to be displayed on a new page, effectively defining the “cover page” as “everything before this”.

Finally, I used the properties of the grouping I defined earlier to create a page break between each instance of the grouping, and apply a page name based on the same expression used to define the grouping. In other words, there will be a page for each first character of the LastName field, and the page name for this page will be the grouping character.

GroupProperties

You can download the complete solution from here. You’ll need to have an instance of SQL Server 2008 R2 with the AdventureWorks2008R2 database (the DataSet in the report assumes that this is in the default instance of SQL Server 2008 R2 on the local computer).

Exporting this report to Excel creates the desired multi-sheet workbook, with a tab for each initial character of the last name, and a “cover page”.

Hopefully, you can see from this article how easy it is to create multi-sheet workbook reports that will add value to your reporting solutions.

Read More >>

Thursday, December 24, 2009

Further Adventures in Spatial Data with SQL Server 2008 R2

Wow! Doesn’t time fly? In November last year I posted the first in a series of blog articles about spatial data in SQL Server 2008. Now here we are over a year later, and I’m working with the November CTP of SQL Server 2008 R2. R2 brings a wealth of enhancements and new features – particularly in the areas of multi-server manageability, data warehouse scalability, and self-service business intelligence. Among the new features that aren’t perhaps getting as much of the spotlight as they deserve, is the newly added support for including maps containing spatial data in SQL Server Reporting Services reports. This enables organizations that have taken advantage of the spatial data support in SQL Server 2008 to visualize that data in reports.

So, let’s take a look at a simple example of how you might create a report that includes spatial data in a map. I’ll base this example on the same Beanie Tracker application I created in the previous examples. To refresh your memory, this application tracks the voyages of a small stuffed bear named Beanie by storing photographs and geo-location data in a SQL Server 2008 database. You can download the script and supporting files you need to create and populate the database from here. The database includes the following two tables:

-- Create a table for photo records
CREATE TABLE Photos
([PhotoID] int IDENTITY PRIMARY KEY,
[Description] nvarchar(200),
[Photo] varbinary(max),
[Location] geography)
GO

-- Create a table to hold country data
CREATE TABLE Countries
(CountryID INT IDENTITY PRIMARY KEY,
CountryName nvarchar(255),
CountryShape geography)
GO

The data in the Photos table includes a Location field that stores the lat/long position where the photograph was taken as a geography point. The Countries table includes a CountryShape field that stores the outline of each country as a geography polygon. This enables me to use the following Transact-SQL query to retrieve the name, country shape, and number of times Beanie has had his photograph taken in each country:

SELECT CountryName,
CountryShape,
(SELECT COUNT(*)
FROM Photos p
WHERE (Location.STIntersects(c.CountryShape) = 1))
AS Visits
FROM Countries c

With the sample data in the database, this query produces the following results:

CountryNameCountryShapeVisits
France0xE6100000 … (geography data in binary format)1
Egypt0xE6100000 … (geography data in binary format)2
Kenya0xE6100000 … (geography data in binary format)1
Italy0xE6100000 … (geography data in binary format)2
United States of America0xE6100000 … (geography data in binary format)7
United Kingdom0xE6100000 … (geography data in binary format)2

To display the results of this query graphically on a map, you can use SQL Server Business intelligence Development Studio or the new Report Builder 3.0 application that ships with SQL Server 2008 R2 Reporting Services. I’ll use Report Builder 3.0, which you can install by using Internet Explorer to browse to the Report Manager interface for the SQL Server 2008 R2 Reporting Services instance where you want to create the report (typically http://<servername>/reports) and clicking the Report Builder button.

When you first start Report Builder 3.0, the new report or dataset page is displayed as shown below (if not, you can start it by clicking New on the Report Builder’s main menu).

Picture1

This page includes an option for the Map Wizard, which provides an easy way to create a report that includes geographic data. To start the wizard, select the Map Wizard option and click Create. This opens the following page:

Picture2

SQL Server 2008 R2 Reporting Services comes with a pre-populated gallery of maps that you can use in your reports. Alternatively, you can import an Environmental Systems Research Institute (ESRI) shapefile, or you can so what I’m doing and use a query that returns spatial data from a SQL Server 2008 database.

After selecting SQL Server spatial query and clicking Next, you can choose an existing dataset or select the option to create a new one. Since I don’t have an existing dataset, I’ll select the option to Add a new dataset with SQL Server spatial data and click Next, and then create a new data source as shown here:

Picture4

On the next screen of the wizard, you can choose an existing table, view, or stored procedure as the source of your data, or you can click Edit as Text to enter your own Transact-SQL query as I’ve done here:

Picture5

The next page enables you to select the spatial data field that you want to display, and provides a preview of the resulting map that will be included in the report.

Picture6

Note that you can choose to embed the spatial data in the report, which increases the report size but ensures that the spatial map data is always available in the report. You can also add a Bing Maps layer, which enables you to “superimpose” your spatial and analytical data over Bing Maps tiles as shown here:

Picture7

Next you can choose the type of map visualization you want to display. These include:

  • Basic Map: A simple visual map that shows geographical areas, lines, and points.
  • Color Analytical Map: a map in which different colors are used to indicate analytical data values (for example, you could use a color range to show sales by region in which more intense colors indicate higher sales)
  • Bubble Map: A map in which the center point of each geographic object is shown as a bubble, the size or color of which indicates an analytical value.

Picture8

To show the number of times Beanie has visited a country, I’m using a bubble map. Since the bubbles must be based on a data value, I must now choose the dataset that contains the values that determine the size of the bubbles.

Picture9

Having chosen the dataset, I now get a confirm or chance to change the default matches that the wizard has detected.

Picture10

Finally, you can choose a visual theme for the map and specify which analytical fields determine bubble size and the fill colors used for the spatial objects.

Picture11

Clicking Finish, generates the report, which you can make further changes to with Report Builder.

Picture12

Selecting the map reveals a floating window that you can use to edit the map layers or move the area of the map that is visible in the map viewport (the rectangle in which the map is displayed).

Picture13

You can make changes to the way the map and its analytical data are displayed by selecting the various options on the layer menus. For example, you can:

  • Click Polygon Properties to specify a data value to be displayed as a tooltip for the spatial shapes on the map.
  • Click Polygon Color Rule to change the rule used to determine the fill colors of the spatial shapes on the map.
  • Click Center Point Properties to add labels to each center point “bubble” on the map.
  • Click Center Point Color Rule to change the rule used to determine the color of the bubbles, including the scale of colors to use and how the values are distributed within that scale.
  • Click Center Point Size Rule to change the rule used to determine the size of the bubbles, including the scale of sizes to use and how the values are distributed within that scale.
  • Click Center Point Marker Type Rule to change the rule used to determine the shape or image of the bubbles, including a range of shapes or images to use and how the values are matched to shapes or images in that range.

At any time, you can preview the report in Report builder by clicking Run. Here’s how my report looks when previewed.

Picture14

When you’re ready to publish the report to the report server, click Save on the main menu, and then click Recent Sites and Servers in the Save As Report dialog box to save the report to an appropriate folder on the report server.

Picture15

After the report has been published, users can view it in their Web browser through the Report manager interface. here’s my published report:

Picture16

I’ve only scratched the surface of what’s possible with the map visualization feature in SQL Server 2008 R2 Reporting Services. When combined with the spatial data support in SQL Server 2008 it really does provide a powerful way to deliver geographical analytics to business users, and hopefully you’ve seen from this article that it’s pretty easy to get up and running with spatial reporting.

Read More >>

Monday, January 19, 2009

SQL Server Reporting Services - Report Builder 2.0

SQL Server 2008 Reporting Services (SSRS 2008) includes the Report Designer and Report Builder 1.0 tools, which you can use to create reports ranging from the very simple to the highly sophisticated. Report Designer is hosted in Business Intelligence Development Studio (BIDS), so you get all of the fine control you need to get your reports exactly as you want them. However, BIDS is a daunting environment for non-developers and it requires a considerable investment on the part of the user in order to become proficient in its use. Report Builder 1.0 (RB 1.0), on the other hand, is targeted at non-developers such as information workers, who need to be able to create ad-hoc reports quickly and easily. It provides easy to use drag and drop functionality in a Microsoft Office-like environment and shields users from the complexity of the underlying data source(s) by enabling them to interact with report models. A report model is an abstraction layer that sits over the top of a data source and exposes the underlying data using business-oriented language that is more meaningful to the end user.

Report Builder 2.0 (RB 2.0) is a new tool that was made available as a separate download at the end of October 2008. It offers various improvements over RB 1.0, but it does not replace it directly; you can use both tools side by side, if required. Whereas RB 1.0 is a ClickOnce application that can be installed by users from the same report server web site where they access their reports, RB 2.0 is a standalone application that must be installed separately where required. (RB 2.0 is scheduled to be released as a ClickOnce version as part of SQL Server 2008 Service Pack 1 – you’ll then be able to choose whether version 1.0 or 2.0 is installed when users click the link on the report server web site).

So what does RB 2.0 offer that RB 1.0 doesn’t? Well, firstly the Office-like theme is continued, but the look and feel are more like Office 2007; for example, there is a ‘ribbon’ in place of the older style toolbar (Figure 1). Whilst this is a matter of personal preference, I see this as an improvement.


Figure 1 – The Report Builder 2.0 user interface

Report creation wizards
RB 2.0 simplifies report creation with the new wizards for creating table, matrix and chart based reports, which guide you through the process. You can select a data source (see below), drag and drop is used to add fields to the report and you can arrange fields into columns, rows and values by using selection boxes. Once you’ve created a basic report, you can easily modify it by adding data regions including lists and gauges (new in SSRS 2008) and report items including images and text boxes.
Access to shared data sources
One of the drawbacks of using RB 1.0 is that it requires a report model to be created in advance so that it can interact with it. RB 2.0 can also access report models, keeping report creation easy for information workers, but it can additionally work with other data sources directly. These can be shared data sources that already exist or embedded sources that you create using RB 2.0 itself. The report creation wizards include connectors for a wide variety of sources (Figure 2). Once you have created your source, you can select the data that you wish to extract by using a text based editor (or in the case of SQL Server connections, a graphical editor).


Figure 2 – Data source properties dialog box


Editing of reports stored on the report Server
RB 2.0 supports the editing of reports that are stored on the report server. This enables users to use RB 2.0 to customize reports that were created and published by using Report Designer or RB 1.0. RB 1.0 is limited in this respect as reports that you create using RB 1.0 and then open and modify using Report Designer cannot then be opened again in RB 1.0, which is somewhat restrictive. Now, a developer can create and publish a sophisticated report using Report Designer, and users can access and modify the report themselves using RB 2.0 or Report Designer without any problem.

Summary
Because of these (and other) improvements, RB 2.0 will be attractive not only to information workers, but for developers too. True, it doesn’t support the full range of functionality that BIDS does, but it supports most of the major items – and it has the added benefit that you don’t need to install BIDS in order to create advanced reports.
For more information on Report Builder 2.0, visit Books Online at http://msdn.microsoft.com/en-us/library/dd207008.aspx
Read More >>